Select hospital characteristics similar to:
Current Measures:
- {[{measure.conditionShortName}]} {[{measure.outcomeKey}]}
Current Hospital:
Current Characteristics:
- {[{summary}]}
Selected Hospitals:
- {[{item.label | lowercase}]}
Selected Sub-regions:
- {[{item.label | lowercase}]}
Selected Regions:
- {[{item.label | lowercase}]}
Selected States:
- {[{item.label | lowercase}]}
Current Measures:
Please select at least one measurement (up to 6)
Current Hospital:
Current Characteristics:
Once you have selected at least one measure, select any number of hospital characteristics to filter by.
- {[{summary}]}
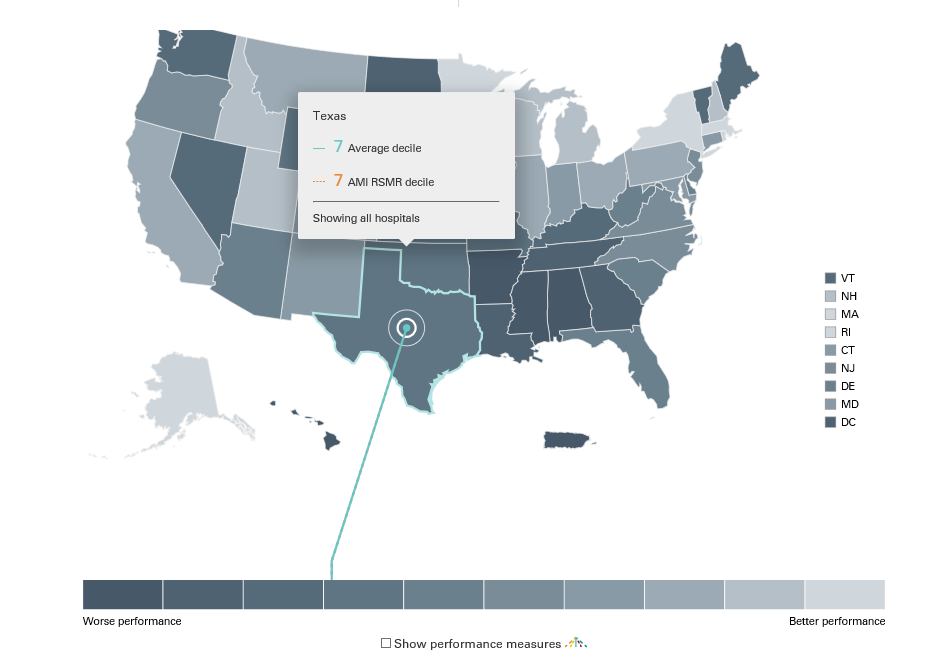
Map View:
Table View
Please note, for data to appear below, you must select at least one region, state, or hospital.
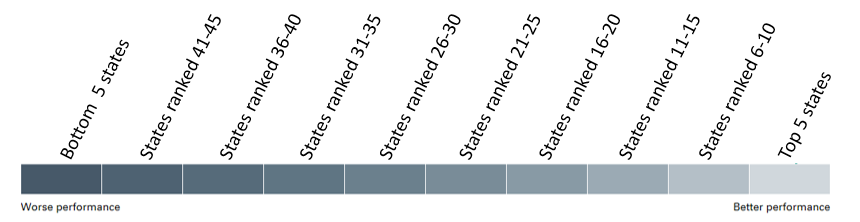
How This Is Calculated
Results at the Hospital Level:
1. All hospitals are ranked in order of decreasing performance [lowest value (best performance) to highest value (worst performance)] for each measure.
2. The hospitals are divided into 10 equal groups based on their ranking for each measure.
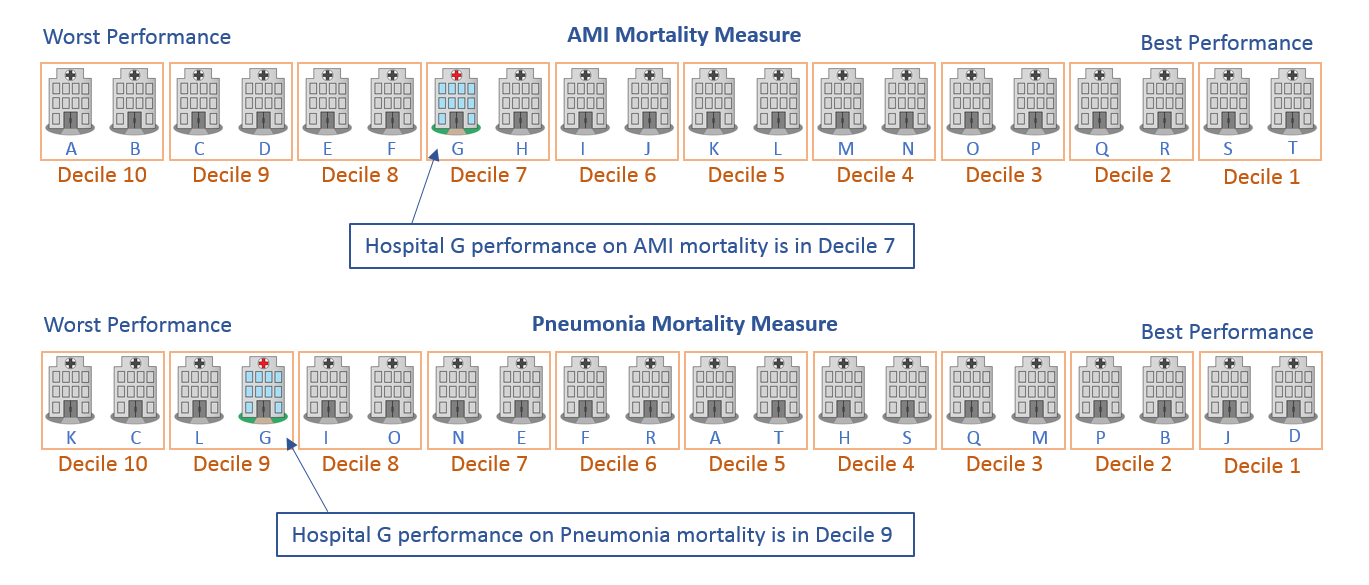
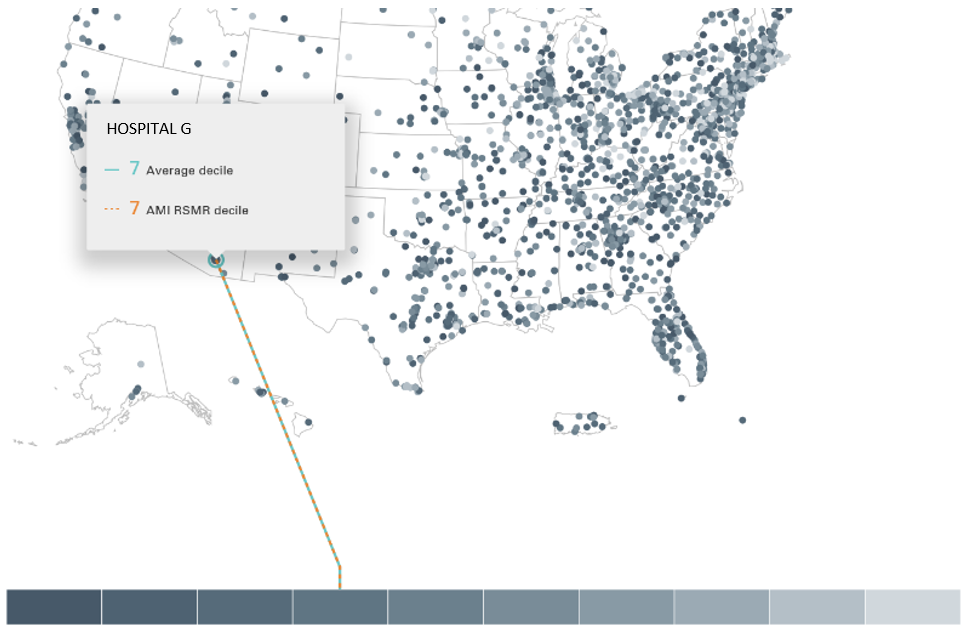
If only one measure is selected, the results at this level will display which of the 10 groups the hospital was assigned to.
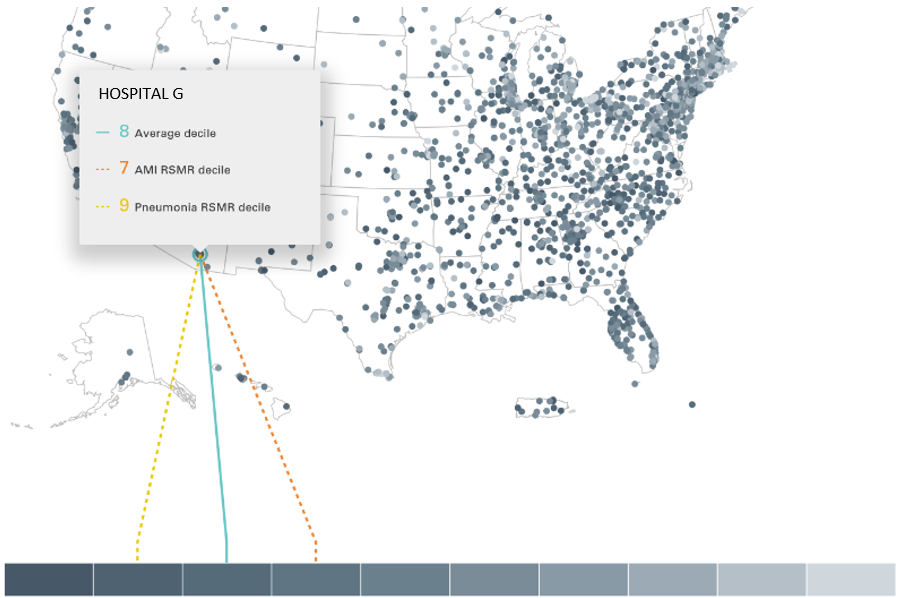
If multiple measures are selected, a simple average of the group assignments is calculated as follows:

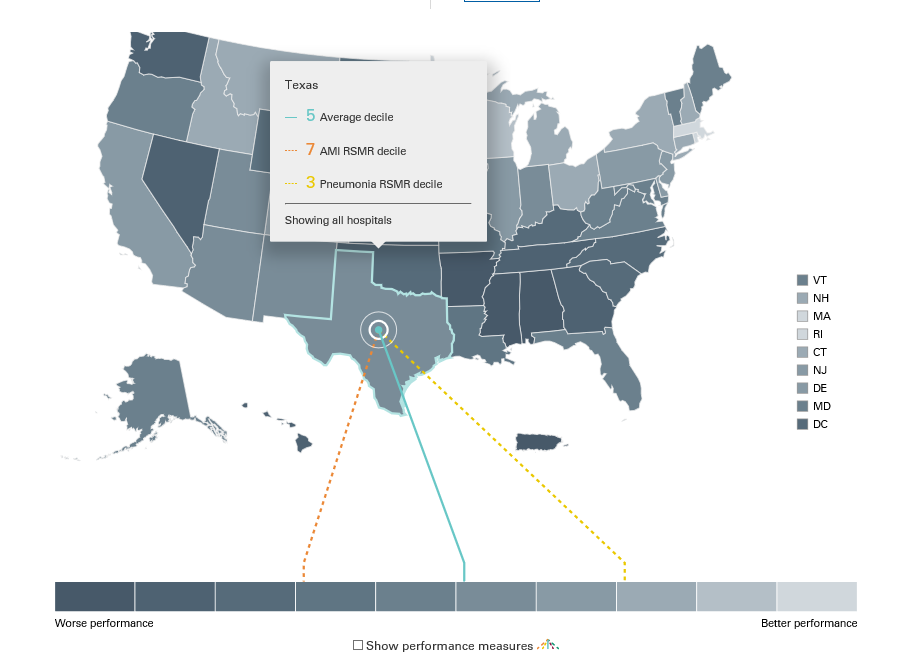
Results at the State Level:
For each measure, all the hospitals within a state are averaged to get state level performance. This is done by taking the hospital performance multiplied by the number of patients seen at that hospital:
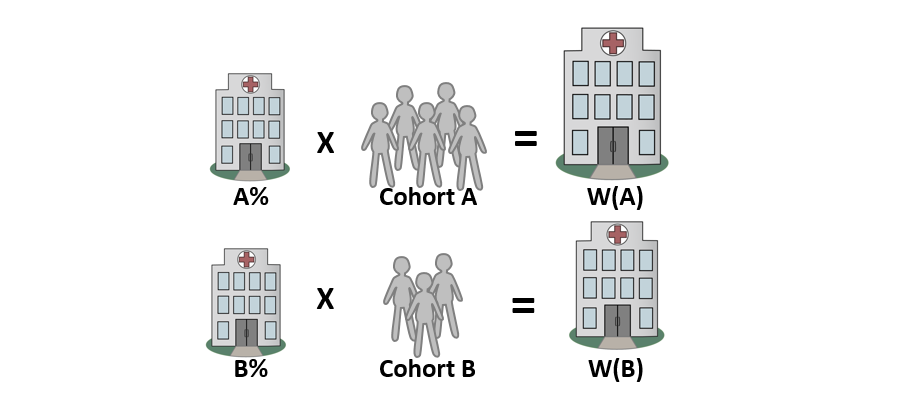
Then, a weighted average of all of the hospitals in the state is calculated:

Then for each measure the states are ranked and placed into deciles:
If only one measure is selected, the results at this level will display which of the 10 groups the state was assigned to.
If multiple measures are selected, a simple average of the group assignments is calculated as follows:

Results for the Subregion Level:
Similar to the results at the state level, to get results for the subregion level for each measure a weighted average of all of the hospitals in the subregion is calculated. Then for each measure the subregions are ranked and placed into deciles.
Results for the Region Level:
To get results for the region level for each measure, a weighted average of all the hospitals in the region is calculated. Then for each measure the regions are ranked 1 through 4. The ranks are averaged if multiple measures are selected.
Notes
For the publicly reported results by hospital, please visit Hospital Compare.
MEASUREMENT PERIOD
The measures included in this visualization have the following measurement period:
Table 1. Included Measures
|
Outcome |
Condition/Procedure |
Measurement Period |
|
Mortality |
Acute Myocardial Infarction |
7/2019 - 6/2022 |
|
Coronary Artery Bypass Graft Surgery |
7/2019 - 6/2022 |
|
|
Chronic Obstructive Pulmonary Disease |
7/2019 - 6/2022 |
|
|
Heart Failure |
7/2019 - 6/2022 |
|
|
Pneumonia |
7/2019 - 6/2022 |
|
|
Stroke |
7/2019 - 6/2022 |
|
|
Complication |
Total hip arthroplasty and/or total knee arthroplasty |
4/2019 - 3/2022 |
|
Readmission |
Acute Myocardial Infarction |
7/2019 - 6/2022 |
|
Coronary Artery Bypass Graft Surgery |
7/2019 - 6/2022 |
|
|
Chronic Obstructive Pulmonary Disease |
7/2019 - 6/2022 |
|
|
Heart Failure |
7/2019 - 6/2022 |
|
|
Hospital-wide |
7/2019 - 6/2022 |
|
|
Pneumonia |
7/2019 - 6/2022 |
|
|
Total hip arthroplasty and/or total knee arthroplasty |
7/2019 - 6/2022 |
|
|
Payment |
Acute Myocardial Infarction |
7/2019 - 6/2022 |
|
Heart Failure |
7/2019 - 6/2022 |
|
|
Pneumonia |
7/2019 - 6/2022 |
|
|
Total hip arthroplasty and/or total knee arthroplasty |
4/2019 - 3/2022 |
|
|
Excess Days in Acute Care |
Acute Myocardial Infarction |
7/2019 - 6/2022 |
|
Heart Failure |
7/2019 - 6/2022 |
|
|
Pneumonia |
7/2019 - 6/2022 |
DATA NOTES
Only hospitals with at least 25 qualifying hospitalizations for a given measure are included in the visualization.
Beginning with the 2019 reporting year, the stroke readmission measure was removed from this data visualization because this measure is no longer reported in the Inpatient Quality Reporting Program (IQR). This measure’s results are still available in reporting years prior to 2019.
Additional data source(s) include:
2018 IPPS IMPACT file
DEFINITIONS
Table 2. Key Definitions
|
Term |
Definition |
|
Region |
Census regions are groupings of states and the District of Columbia that subdivide the United States. There are four census regions: Midwest, Northeast, South, and West |
|
Sub-region |
Census sub-regions are groupings of states and the District of Columbia that further subdivide the census regions of the United States. There are nine census sub-regions: New England, Middle Atlantic, South Atlantic, East North Central, East South Central, West North Central, East North Central, Mountain, and Pacific |
|
Decile |
Ten equal groups into which a population can be divided per the distribution of values |
|
Hospital population |
The type of patient population that receives care at a hospital |
|
Number of beds |
The number of staffed beds available at a hospital |
|
Rank |
Position when units are ordered based on the distribution of values |
|
Safety-net hospital |
A hospital that provides a significant level of care to low income, uninsured, and patient populations with social risk factors |
|
Teaching Hospital |
A hospital or medical center that provides clinical education and training to future or current health professionals |
Methodology Sources
AMI, COPD, Heart Failure, and Pneumonia Readmission Measures Methodology: DeBuhr J, McDowell K, Grady J, et al. 2023 Condition-Specific Measures Updates and Specifications Report Hospital-Level 30-Day Risk-Standardized Readmission Measures: Acute Myocardial Infarction – Version 16.0, Chronic Obstructive Pulmonary Disease – Version 12.0, Heart Failure – Version 16.0, Pneumonia – Version 16.0. https://qualitynet.cms.gov/inpatient/measures/readmission/resources Available as of Spring 2023.
CABG and Hip/Knee Arthroplasty Readmission Measures Methodology: DeBuhr J, McDowell K, Grady J, et al. 2023 Procedure-Specific Measures Updates and Specifications Report Hospital-Level 30-Day Risk-Standardized Readmission Measures: Isolated Coronary Artery Bypass Graft (CABG) Surgery – Version 10.0, Elective Primary Total Hip Arthroplasty (THA) and/or Total Knee Arthroplasty (TKA) – Version 12.0. https://qualitynet.cms.gov/inpatient/measures/readmission/methodology Available as of Spring 2023.
AMI, COPD, Heart Failure, Pneumonia, and Stroke Mortality Measures Methodology: DeBuhr J, McDowell K, Grady J, et al. 2023 Condition-Specific Measures Updates and Specifications Report Hospital-Level 30-Day Risk-Standardized Mortality Measures: Acute Myocardial Infarction – Version 17.0, Chronic Obstructive Pulmonary Disease – Version 12.0, Heart Failure – Version 17.0, Pneumonia – Version 17.0, Stroke – Version 12.0. https://qualitynet.cms.gov/inpatient/measures/mortality/resources. Available as of Spring 2023.
CABG Mortality Measure Methodology: DeBuhr J, McDowell K, Grady J, et al. 2023 Procedure-Specific Measure Updates and Specifications Report Hospital-Level 30-Day Risk-Standardized Mortality Measure: Isolated Coronary Artery Bypass Graft (CABG) Surgery – Version 10.0. https://qualitynet.cms.gov/inpatient/measures/mortality/methodology. Available as of Spring 2023.
Hip/Knee Arthroplasty Complication Measure Methodology: DeBuhr J, McDowell K, Grady J, et al. 2023 Procedure-Specific Measure Updates and Specifications Report Hospital-Level Risk-Standardized Complication Measure: Elective Primary Total Hip Arthroplasty (THA) and/or Total Knee Arthroplasty (TKA) – Version 12.0. https://qualitynet.cms.gov/inpatient/measures/complication/resources Available as of Spring 2023.
AMI, Heart Failure, Pneumonia, and Elective Primary Total Hip Arthroplasty (THA) and/or Total Knee Arthroplasty (TKA) Payment Measures Methodology: DeBuhr J, McDowell K, Grady J, et al. 2023 Measure Updates and Specifications Report Hospital-Level Risk-Standardized Payment Measures: Acute Myocardial Infarction – Version 12.0, Heart Failure – Version 10.0, Pneumonia – Version 10.0, Elective Primary Total Hip Arthroplasty (THA) and/or Total Knee Arthroplasty (TKA) – Version 9.0. https://qualitynet.cms.gov/inpatient/measures/payment/resources Available as of Spring 2023.
AMI, Heart Failure, Pneumonia Excess Days in Acute Care Measure Methodology: DeBuhr J, McDowell K, Grady J, et al. 2023 Condition-Specific Measures Updates and Specification Report Hospital-Level 30-Day Risk-Standardized Excess Days in Acute Care Measures: Acute Myocardial Infarction – Version 8.0, Heart Failure – Version 8.0, Pneumonia – Version 7.0. https://qualitynet.cms.gov/inpatient/measures/edac/resources Available as of Spring 2023.
Hospital-Wide Readmission Measure Methodology: DeBuhr J, McDowell K, Grady J, et al. 2020 All-Cause Hospital-Wide Measure Updates and Specifications Report: Hospital-Level 30-Day Risk-Standardized Readmission Measure – Version 12.0 https://qualitynet.cms.gov/inpatient/measures/readmission/methodology Available as of Spring 2023.
Related Resources
To view PDF documents you will need the Adobe Acrobat Reader.
-
AMI, COPD, Heart Failure, Pneumonia, and Stroke Mortality: Hospital Variation
[PDF, 252.01 KB]Variation in 30-day mortality rates across hospitals following admission for AMI, COPD, Heart Failure, Pneumonia and Stroke (July 2013 -…
-
AMI, COPD, Heart Failure, Pneumonia, and Stroke Readmission: Hospital Variation
[PDF, 250.5 KB]Variation in 30-day readmission rates across hospitals following admission for AMI, COPD, Heart Failure, Pneumonia, and Stroke (July 2013 -…
-
Hospital-Wide Readmission: Results by Hospital Characteristic
[PDF, 182.1 KB]Hospital-wide readmission measure results by hospital characteristics: safety-net status, teaching status, and urban or rural location …