Select hospital characteristics similar to:
Select hospital characteristics:
Current Profiles:
-
{[{profile.label}]}
- {[{summary}]}
editing...
{[{ measure.condition }]}
{[{ measure.description }]}
Summary of Hospital Profiles
- All Hospitals
-
{[{p.label}]}
- {[{summary}]}
Table View
| {[{p.label}]} | ||
|---|---|---|
|
{[{measure.measure.condition}]}
{[{measure.measure.description}]} |
|
|
Notes
For the publicly reported results by hospital, please visit Hospital Compare.
MEASUREMENT PERIOD
The measures included in this visualization have the following measurement period:
Table 1. Included Measures
|
Outcome |
Condition/Procedure |
Measurement Period |
|
Mortality |
Acute Myocardial Infarction |
7/2014 - 6/2017 |
|
Coronary Artery Bypass Graft Surgery |
7/2014 - 6/2017 |
|
|
Chronic Obstructive Pulmonary Disease |
7/2014 - 6/2017 |
|
|
Heart Failure |
7/2014 - 6/2017 |
|
|
Pneumonia |
7/2014 - 6/2017 |
|
|
Stroke |
7/2014 - 6/2017 |
|
|
Complication |
Total hip arthroplasty and/or total knee arthroplasty |
7/2014 - 6/2017 |
|
Readmission |
Acute Myocardial Infarction |
7/2014 - 6/2017 |
|
Coronary Artery Bypass Graft Surgery |
7/2014 - 6/2017 |
|
|
Chronic Obstructive Pulmonary Disease |
7/2014 - 6/2017 |
|
|
Heart Failure |
7/2014 - 6/2017 |
|
|
Hospital-wide |
7/2014 - 6/2017 |
|
|
Pneumonia |
7/2014 - 6/2017 |
|
|
Total hip arthroplasty and/or total knee arthroplasty |
7/2014 - 6/2017 |
|
|
Payment |
Acute Myocardial Infarction |
7/2014 - 6/2017 |
|
Heart Failure |
7/2014 - 6/2017 |
|
|
Pneumonia |
7/2014 - 6/2017 |
|
|
Total hip arthroplasty and/or total knee arthroplasty |
4/2014 - 3/2017 |
|
|
Excess Days in Acute Care |
Acute Myocardial Infarction |
7/2014 - 6/2017 |
|
Heart Failure |
7/2014 - 6/2017 |
|
|
Pneumonia |
7/2014 - 6/2017 |
DATA NOTES
Only hospitals with at least 25 qualifying hospitalizations for a given measure are included in the visualization.
Additional data source(s) include:
|
2017 IPPS IMPACT file |
|
American Hospital Association (AHA) Survey 2016 |
DEFINITIONS
Table 2. Key Definitions
|
Term |
Definition |
|
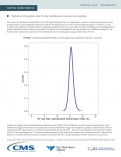
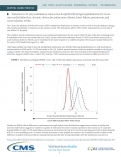
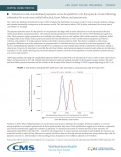
Histogram |
A graphical representation of the distribution of numerical data. Please see “Figure Explanations” in Related Research for more information. |
|
Hospital population |
The type of patient population that receives care at a hospital |
|
Number of beds |
The number of staffed beds available at a hospital |
|
Safety-net hospital |
A hospital that provides a significant level of care to low income, uninsured, and patient populations with social risk factors |
|
Teaching Hospital |
A hospital or medical center that provides clinical education and training to future or current health professionals |
|
Proportion African-American |
A hospital serving a high proportion (top 10 decile) or low proportion (bottom decile) of African-American patients |
|
Proportion with Medicaid |
A hospital serving a high proportion (top 10 decile) or low proportion (bottom decile) of African-American patients |
Methodology Sources
AMI, Heart Failure, Pneumonia, COPD, and Stroke Readmission Measures Methodology: Jaymie Simoes, Jacqueline N. Grady, Jo DeBuhr, et al. 2018 Condition-Specific Measures Updates and Specifications Report Hospital-Level 30-Day Risk-Standardized Readmission Measures: Acute Myocardial Infarction – Version 10.0, Chronic Obstructive Pulmonary Disease – Version 6.0, Heart Failure – Version 10.0, Pneumonia – Version 10.0 Stroke – Version 6.0. https://www.qualitynet.org/inpatient/measures/readmission/resources#tab3. Available as of April 4, 2018.
AMI, Heart Failure, Pneumonia, COPD, and Stroke Mortality Measures Methodology: Jaymie Simoes, Jacqueline N. Grady, Jo DeBuhr, et al. 2018 Condition-Specific Measures Updates and Specifications Report Hospital-Level 30-Day Risk-Standardized Mortality Measures: Acute Myocardial Infarction – Version 11.0, Chronic Obstructive Pulmonary Disease – Version 6.0, Heart Failure – Version 11.0, Pneumonia – Version 11.0, Stroke – Version 6.0. https://www.qualitynet.org/inpatient/measures/mortality/resources#tab3. Available as of April 4, 2018.
Hip/Knee Arthroplasty Complication Measure Methodology: Jaymie Simoes, Jacqueline N. Grady, Jo DeBuhr, et al. 2018 Procedure-Specific Measure Updates and Specifications Report Hospital-Level Risk-Standardized Complication Measure: Elective Primary Total Hip Arthroplasty (THA) and/or Total Knee Arthroplasty (TKA) – Version 6.0. https://www.qualitynet.org/inpatient/measures/complication/resources#tab3. Available as of April 4, 2018.
AMI, Heart Failure, and Pneumonia Payment Measures Methodology: Jaymie Simoes, Jacqueline N. Grady, Jo DeBuhr, et al. 2018 Measure Updates and Specifications Report Hospital-Level Risk-Standardized Payment Measures: Acute Myocardial Infarction – Version 6.0 Heart Failure – Version 4.0 Pneumonia – Version 4.0 Elective Primary Total Hip Arthroplasty (THA) and/or Total Knee Arthroplasty (TKA) – Version 3.0. https://www.qualitynet.org/inpatient/measures/payment/resources#tab2. Available as of April 4, 2018.
Hospital-Wide Readmission Measure Methodology: Jaymie Simoes, Jacqueline N. Grady, Jo DeBuhr, et al. 2018 All-Cause Hospital-Wide Measure Updates and Specifications Report: Hospital-Level 30-Day Risk-Standardized Readmission Measure – Version 6.0. https://qualitynet.org/inpatient/measures/readmission/resources#tab3. Available as of April 4, 2018.
CABG and Hip/Knee Arthroplasty Readmission Measures Methodology: Jaymie Simoes, Jacqueline N. Grady, Jo DeBuhr, et al. 2018 Procedure-Specific Measures Updates and Specifications Report Hospital-Level 30-Day Risk-Standardized Readmission Measures: Isolated Coronary Artery Bypass Graft (CABG) Surgery – Version 4.0, Elective Primary Total Hip Arthroplasty (THA) and/or Total Knee Arthroplasty (TKA) – Version 6.0. https://www.qualitynet.org/inpatient/measures/readmission/resources#tab3. Available as of April 4, 2018.
AMI, Heart Failure, Pneumonia Excess Days in Acute Care Measure Methodology: Jaymie Simoes, Jacqueline N. Grady, Jo DeBuhr, et al. 2018 Condition-Specific Measures Updates and Specification Report Hospital-Level 30-Day Risk-Standardized Excess Days in Acute Care Measures: Acute Myocardial Infarction – Version 2.0, Heart Failure – Version 2.0. https://www.qualitynet.org/inpatient/measures/payment/resources#tab3. Available as of April 4, 2018.
CABG Mortality Measure Methodology: Jaymie Simoes, Jacqueline N. Grady, Jo DeBuhr, et al. 2018 Procedure-Specific Measure Updates and Specifications Report Hospital-Level 30-Day Risk-Standardized Mortality Measure: Isolated Coronary Artery Bypass Graft (CABG) Surgery – Version 4.0. https://www.qualitynet.org/inpatient/measures/mortality/resources#tab3 Available as of April 4, 2018.
Related Research
To view PDF documents you will need the Adobe Acrobat Reader.
-
Hospital-Wide Readmission: Hospital Variation
[PDF, 223.66 KB]Variation in 30-day hospital-wide readmission rates across hospitals (July 2014 - June 2015)
-
AMI, COPD, Heart Failure, Pneumonia, and Stroke Readmission: Hospital Variation
[PDF, 250.5 KB]Variation in 30-day readmission rates across hospitals following admission for AMI, COPD, Heart Failure, Pneumonia, and Stroke (July 2013 -…
-
AMI, Heart Failure, and Pneumonia Payment: Hospital Variation
[PDF, 246.56 KB]Trends in national 30-day standardized payments across hospitals following admission for AMI, heart failure, and pneumonia (July 2013 -…