{[{vizh.year}]} Measure Reporting Year
Table View
How This Is Calculated
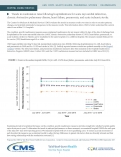
To calculate three-year trends, we examined the national measure results for each year of the three-year public reporting measurement periods. The dates for each year of data collection in the public reporing measurement period are listed in the notes section below. We allow users to view the results by hospital characteristic profiles with 5 or more hospitals.
-
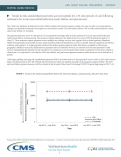
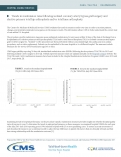
For each year of the three-year measurement period, all hospitals are ranked in order of performance and the median is determined.

-
The graphs use units of percent change, with the first year of the performance period fixed at zero and subsequent years located relative to the first. The following formula is used to calculate percent change:


-
For each year of the three-year measurement period, the 25th and 75th percentiles determine the interquartile ranges for the results.

Notes
Data Sources
-
Medicare Part A and B administrative claims and enrollment databases (2016-2019)
-
Inpatient Prospective Payment System (IPPS) Improving Medicare Post-Acute Care Transformation (IMPACT) Act File 2019
Beginning with the 2019 reporting year, the stroke readmission measure was removed from this data visualization because this measure is no longer reported in the Inpatient Quality Reporting Program (IQR). This measure’s results are still available in reporting years prior to 2019.
Table 1. Included Measures
|
Outcome |
Condition/Procedure |
Measurement Period |
|
Mortality |
Acute Myocardial Infarction, Coronary Artery Bypass Graft Surgery, Chronic Obstructive Pulmonary Disease, Heart Failure, Pneumonia, Stroke |
Year 1: 7/1/2016 – 6/30/2017 Year 2: 7/1/2017 – 6/30/2018 Year 3: 7/1/2018 – 6/30/2019
|
|
Complication |
Total hip arthroplasty and/or total knee arthroplasty |
4/2016 - 3/2019 |
|
Readmission |
Acute Myocardial Infarction, Coronary Artery Bypass Graft Surgery, Chronic Obstructive Pulmonary Disease, Heart Failure, Pneumonia, Stroke, Total hip arthroplasty and/or total knee arthroplasty |
Year 1: 7/1/2016 – 6/30/2017 Year 2: 7/1/2017 – 6/30/2018 Year 3: 7/1/2018 – 6/30/2019 |
|
Payment |
Acute Myocardial Infarction, Heart Failure, Pneumonia |
Year 1: 7/1/2016 – 6/30/2017 Year 2: 7/1/2017 – 6/30/2018 Year 3: 7/1/2018 – 6/30/2019 |
Methodology Sources
AMI, COPD, Heart Failure, and Pneumonia Readmission Measures Methodology: DeBuhr J, McDowell K, Grady J, et al. 2020 Condition-Specific Measures Updates and Specifications Report Hospital-Level 30-Day Risk-Standardized Readmission Measures: Acute Myocardial Infarction – Version 13.0, Chronic Obstructive Pulmonary Disease – Version 9.0, Heart Failure – Version 13.0, Pneumonia – Version 13.0. https://qualitynet.cms.gov/files/609524402be51c001edf6195?filename=2020_Readmission_Meas_Updates_Specs.zip. Available as of Spring 2020.
CABG and Hip/Knee Arthroplasty Readmission Measures Methodology: DeBuhr J, McDowell K, Grady J, et al. 2020 Procedure-Specific Measures Updates and Specifications Report Hospital-Level 30-Day Risk-Standardized Readmission Measures: Isolated Coronary Artery Bypass Graft (CABG) Surgery – Version 7.0, Elective Primary Total Hip Arthroplasty (THA) and/or Total Knee Arthroplasty (TKA) – Version 9.0. https://qualitynet.cms.gov/files/609524402be51c001edf6195?filename=2020_Readmission_Meas_Updates_Specs.zip. Available as of Spring 2020.
AMI, COPD, Heart Failure, Pneumonia, and Stroke Mortality Measures Methodology: DeBuhr J, McDowell K, Grady J, et al. 2020 Condition-Specific Measures Updates and Specifications Report Hospital-Level 30-Day Risk-Standardized Mortality Measures: Acute Myocardial Infarction – Version 14.0, Chronic Obstructive Pulmonary Disease – Version 9.0, Heart Failure – Version 14.0, Pneumonia – Version 14.0, Stroke – Version 9.0. https://qualitynet.cms.gov/files/607333022402a2001eb9e25d?filename=2020_Mort_Meas_UpdtsSpecsResrc.zip. Available as of Spring 2020.
CABG Mortality Measure Methodology: DeBuhr J, McDowell K, Grady J, et al. 2020 Procedure-Specific Measure Updates and Specifications Report Hospital-Level 30-Day Risk-Standardized Mortality Measure: Isolated Coronary Artery Bypass Graft (CABG) Surgery – Version 7.0. https://qualitynet.cms.gov/files/607333022402a2001eb9e25d?filename=2020_Mort_Meas_UpdtsSpecsResrc.zip. Available as of Spring 2020.
Hip/Knee Arthroplasty Complication Measure Methodology: DeBuhr J, McDowell K, Grady J, et al. 2020 Procedure-Specific Measure Updates and Specifications Report Hospital-Level Risk-Standardized Complication Measure: Elective Primary Total Hip Arthroplasty (THA) and/or Total Knee Arthroplasty (TKA) – Version 9.0. https://qualitynet.cms.gov/files/60734125aba8620022335c08?filename=2020_THA_TKA%20Comp_MUS_Rpt.zip. Available as of Spring 2020.
AMI, Heart Failure, Pneumonia, and Elective Primary Total Hip Arthroplasty (THA) and/or Total Knee Arthroplasty (TKA) Payment Measures Methodology: DeBuhr J, McDowell K, Grady J, et al. 2020 Measure Updates and Specifications Report Hospital-Level Risk-Standardized Payment Measures: Acute Myocardial Infarction – Version 9.0, Heart Failure – Version 7.0, Pneumonia – Version 7.0, Elective Primary Total Hip Arthroplasty (THA) and/or Total Knee Arthroplasty (TKA) – Version 6.0. https://qualitynet.cms.gov/files/6092dd81fd340b002259fde6?filename=2020_Payment_AUS_Rprt.zip. Available as of Spring 2020.
AMI, Heart Failure, Pneumonia Excess Days in Acute Care Measure Methodology: DeBuhr J, McDowell K, Grady J, et al. 2020 Condition-Specific Measures Updates and Specification Report Hospital-Level 30-Day Risk-Standardized Excess Days in Acute Care Measures: Acute Myocardial Infarction – Version 5.0, Heart Failure – Version 5.0, Pneumonia – Version 4.0. https://qualitynet.cms.gov/files/6092b1cdfd340b002259fdaf?filename=2020_EDAC_MeasMethRpt.pdf. Available as of Spring 2020.
Hospital-Wide Readmission Measure Methodology: DeBuhr J, McDowell K, Grady J, et al. 2020 All-Cause Hospital-Wide Measure Updates and Specifications Report: Hospital-Level 30-Day Risk-Standardized Readmission Measure – Version 9.0 https://qualitynet.cms.gov/files/609524402be51c001edf6195?filename=2020_Readmission_Meas_Updates_Specs.zip. Available as of Spring 2020.
Related Research
To view PDF documents you will need the Adobe Acrobat Reader.
-
AMI, COPD, Heart Failure, Pneumonia, and Stroke Readmission: Three Year Trends
[PDF, 295.86 KB]Trends in national 30-day readmission rates across hospitals following admission for AMI, COPD, heart failure, pneumonia, and stroke (July…
-
AMI, Heart Failure, and Pneumonia Payment: Three Year Trends
[PDF, 268.8 KB]Trends in national 30-day standardized payments across hospitals following admission for AMI, heart failure, and pneumonia (July 2013 -…
-
CABG and Hip/Knee Arthroplasty Readmissions: Three Year Trends
[PDF, 339.54 KB]Trends in national 30-day readmission rates across hospitals following admission for CABG and hip/knee arthroplasty (July 2013 - June 2016)