Compare within outcomes:
Or
Compare across outcomes:
Current Characteristics:
- {[{summary}]}
Table View
| {[{selectedOptionPrettyLabel}]} | Total hospitals |
Same {[{quantile}]}
{[{$index}]} {[{ $index > 1 ? quantiles : quantile}]} difference |
|---|---|---|
| {[{primaryMeasure.short_name}]} {[{compType === "across" ? primaryMeasure.short_desc : ""}]} / {[{compare.short_name}]} {[{compType === "across" ? compare.short_desc : ""}]} | {[{compare.calculated.total_hospitals}]} |
{[{ (bucket / compare.calculated.total_hospitals * 100) | number:0 }]}% ({[{bucket}]} |
How Do We Determine Agreement
For Quartiles, Quintiles, and Deciles
1. All hospitals are ranked in order of decreasing performance on the selected reference measure.
2. The hospitals are divided into groups based on their ranking.
-
4 groups for quartiles, 5 groups for quintiles, 10 groups for deciles
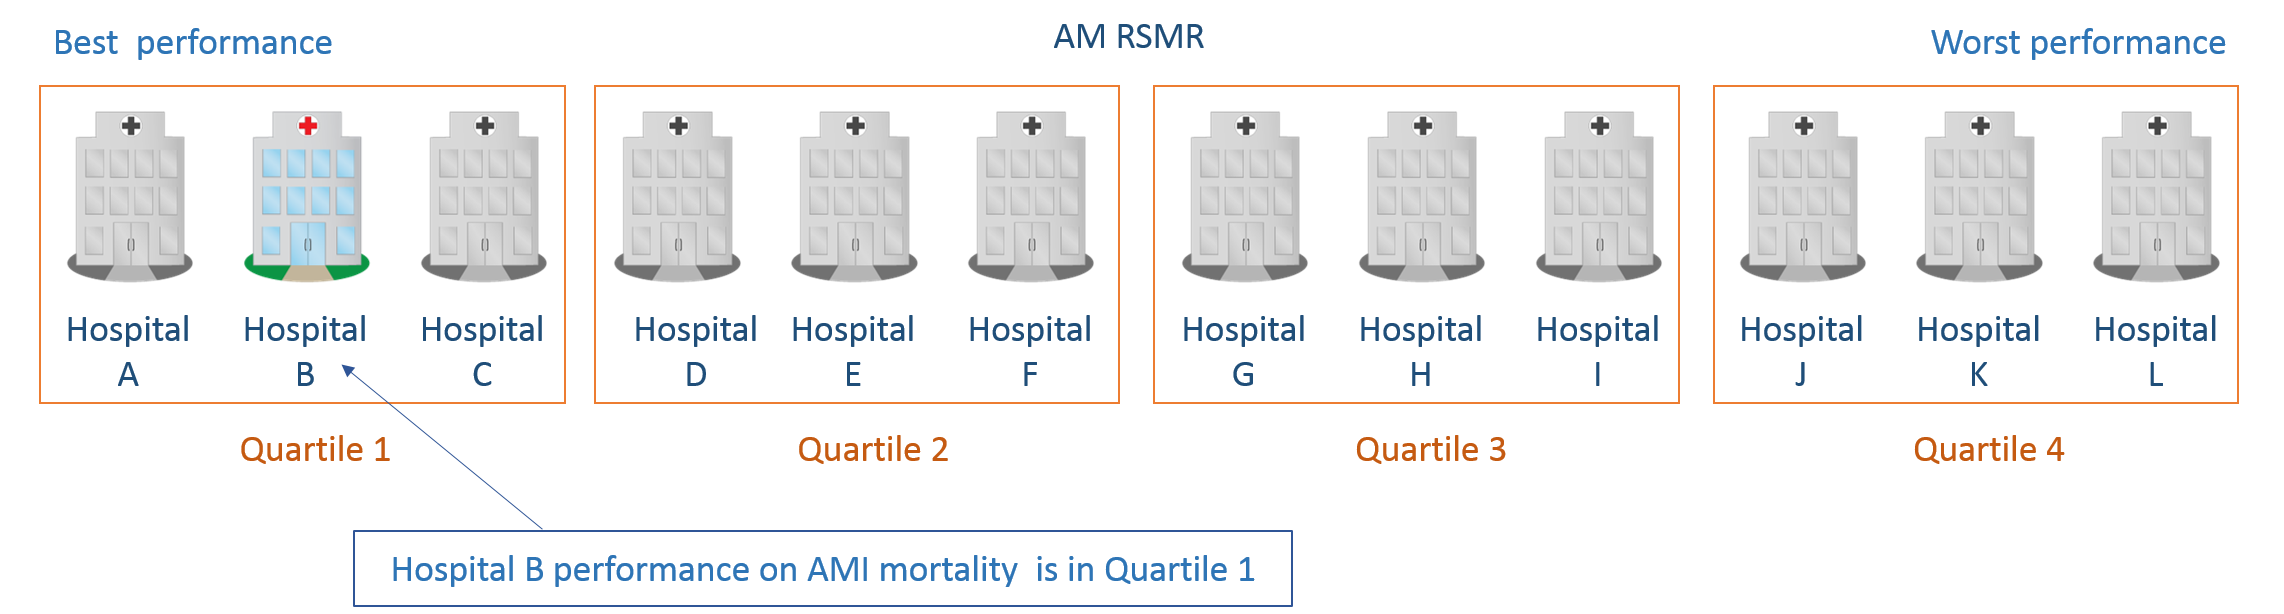
3. Steps 1 and 2 are repeated for all measures being compared to the reference measure.
-
Within outcomes, the reference measure is compared to all other measures that have the same outcome (for example, AMI mortality compared to all other mortality measures)
-
Across outcomes selection, the reference measure is compared to measures with different outcomes but the same condition (for example, AMI mortality vs. AMI payment)
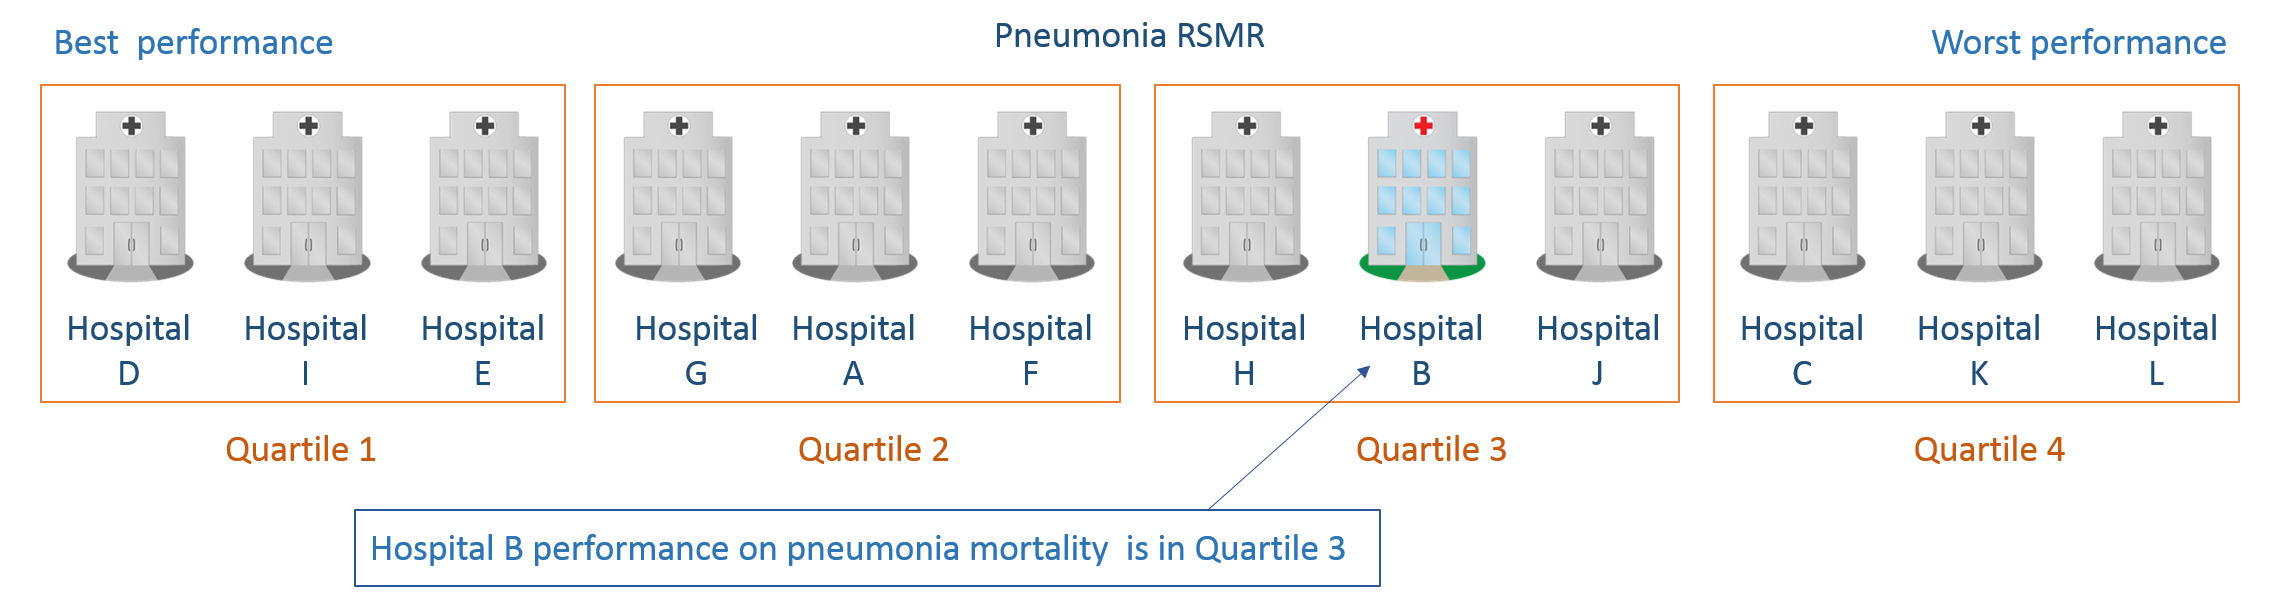
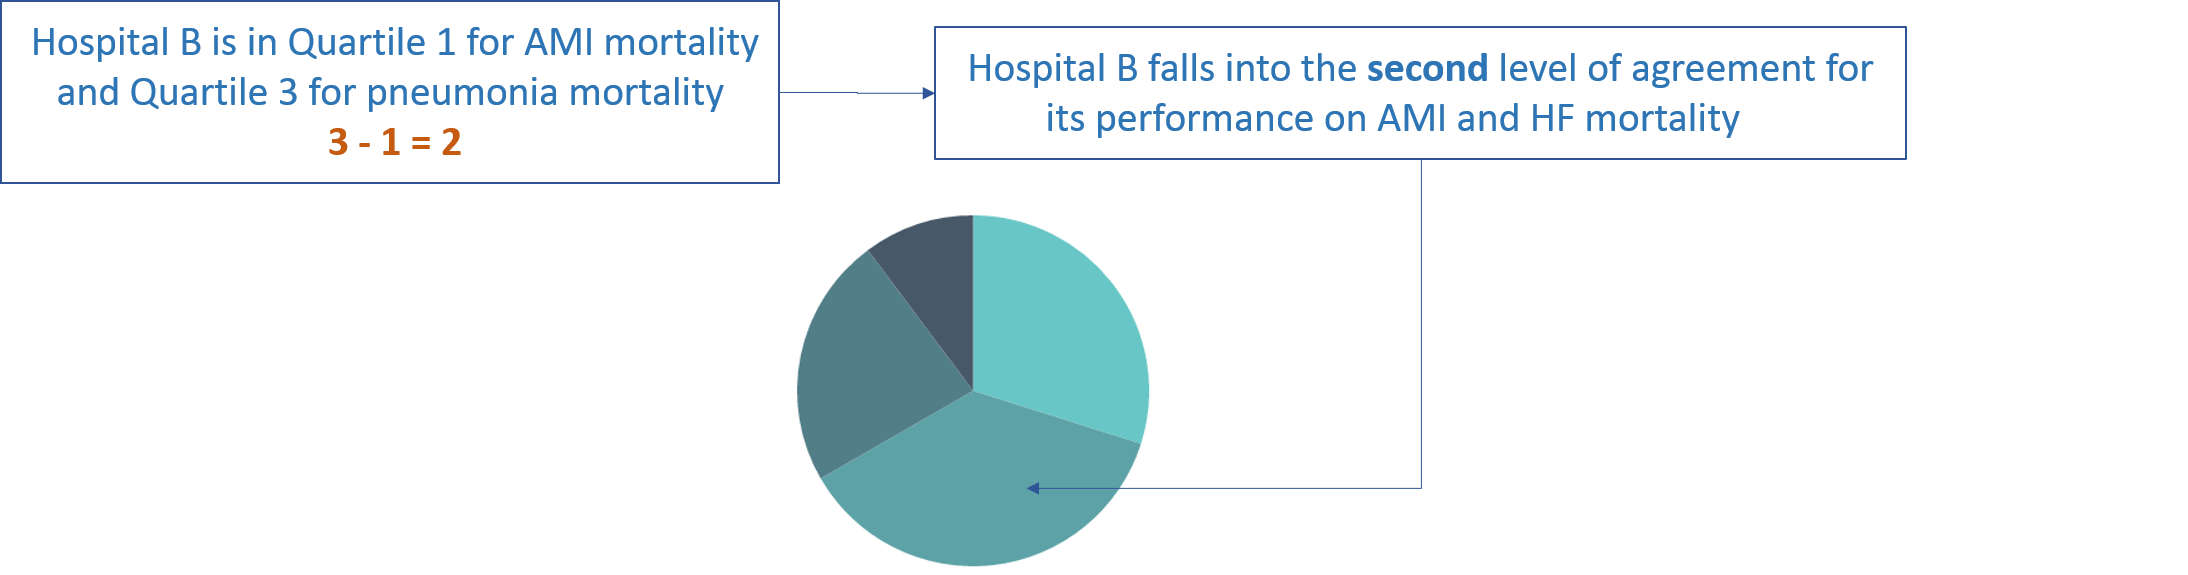
4. For any combination of two measures, the level of agreement for each hospital on the two measures is determined by the difference in the hospital’s group ranking (quartile, quintile, or decile number) for the two measures.
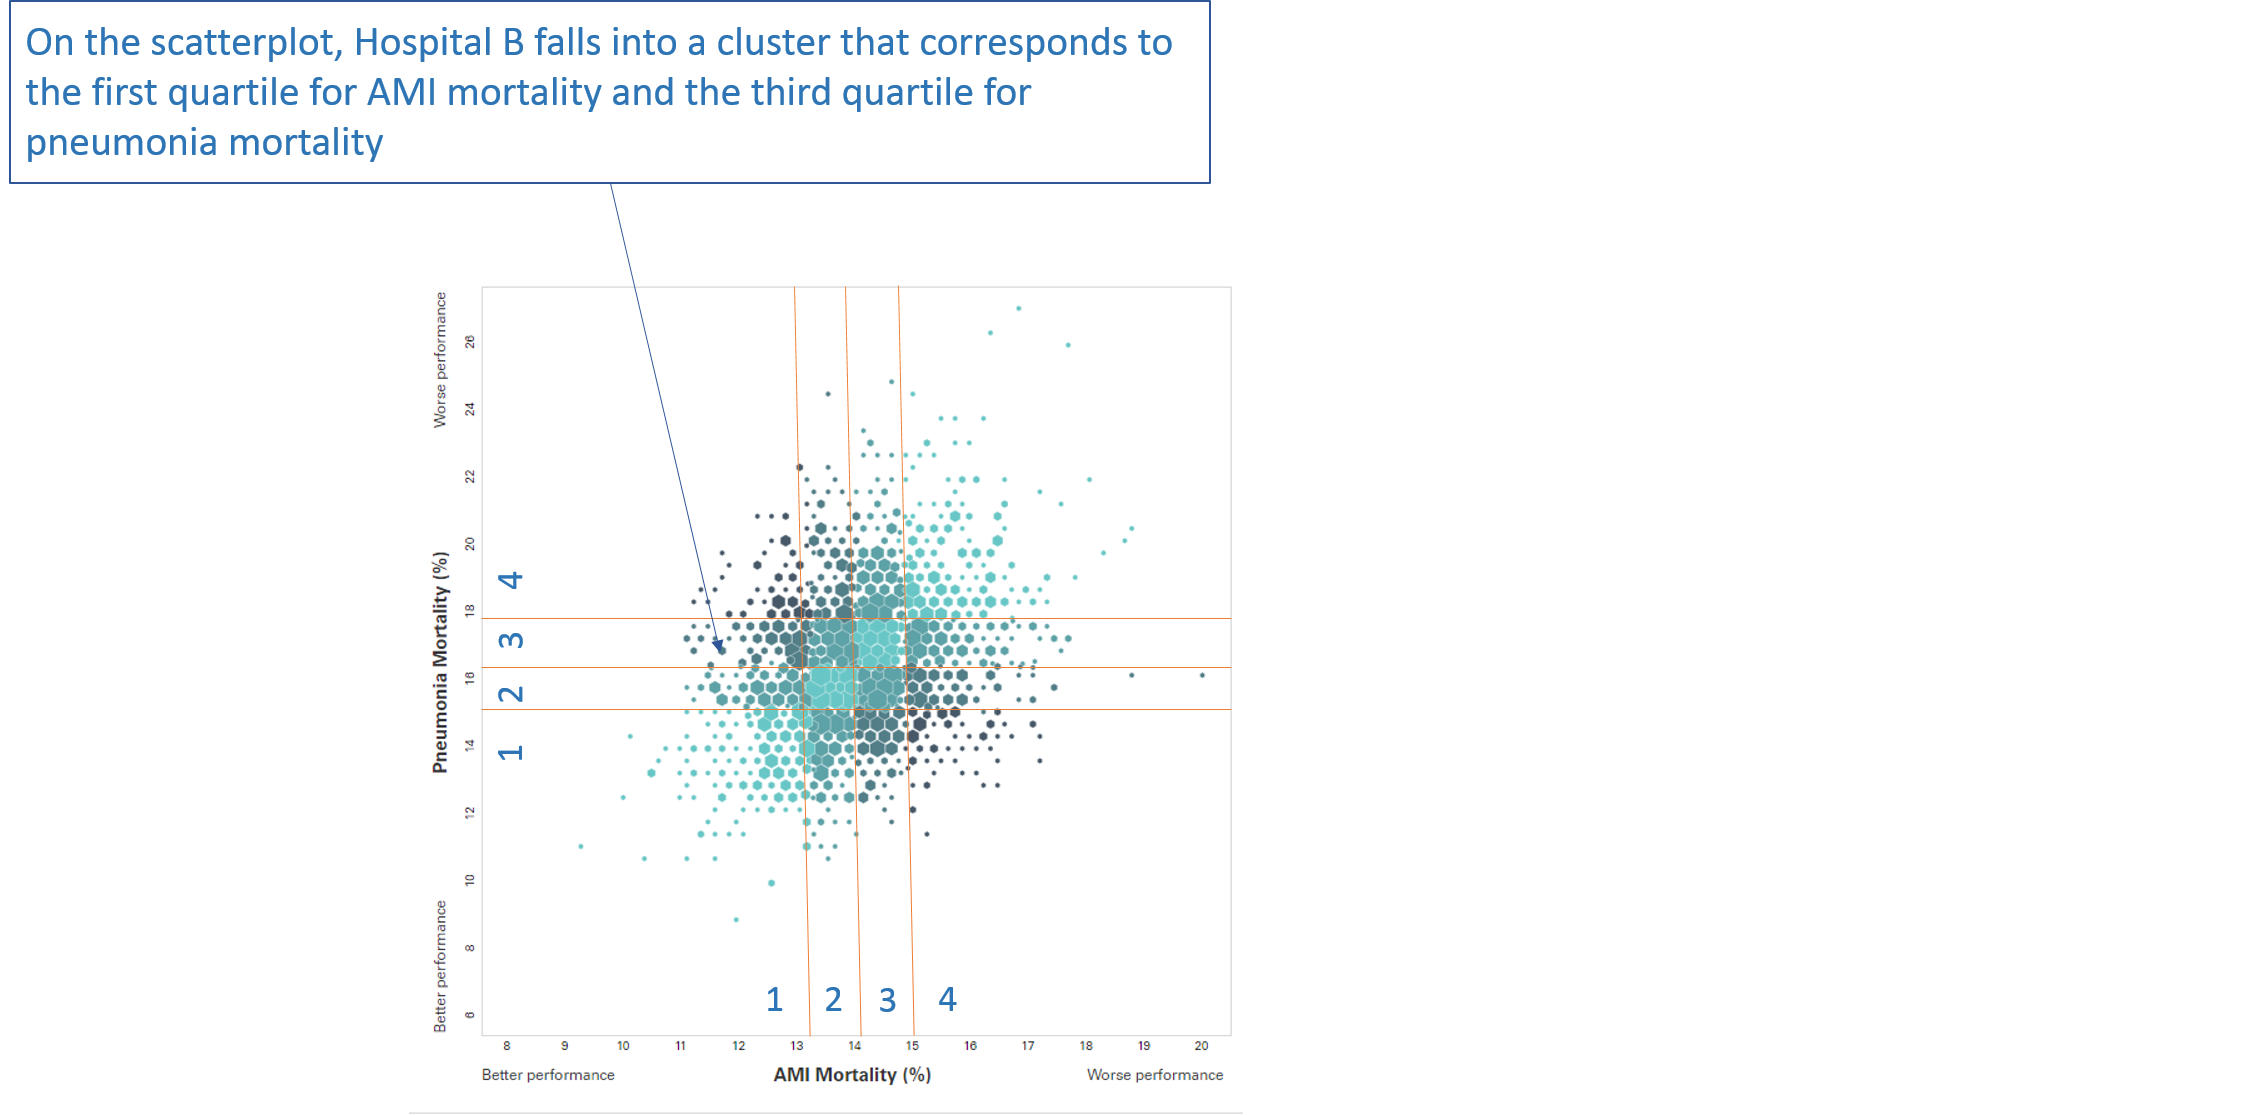
5. On the scatterplot, the hospitals are displayed in clusters that corresponds to their measure results and group rankings.
Notes
For the publicly reported results by hospital, please visit Hospital Compare.
MEASUREMENT PERIOD
The measures included in this visualization have the following measurement period:
Table 1. Included Measures
|
Outcome |
Condition/Procedure |
Measurement Period |
|
Mortality |
Acute Myocardial Infarction |
7/2019 - 6/2022 |
|
Coronary Artery Bypass Graft Surgery |
7/2019 - 6/2022 |
|
|
Chronic Obstructive Pulmonary Disease |
7/2019 - 6/2022 |
|
|
Heart Failure |
7/2019 - 6/2022 |
|
|
Pneumonia |
7/2019 - 6/2022 |
|
|
Stroke |
7/2019 - 6/2022 |
|
|
Complication |
Total hip arthroplasty and/or total knee arthroplasty |
4/2019 - 3/2022 |
|
Readmission |
Acute Myocardial Infarction |
7/2019 - 6/2022 |
|
Coronary Artery Bypass Graft Surgery |
7/2019 - 6/2022 |
|
|
Chronic Obstructive Pulmonary Disease |
7/2019 - 6/2022 |
|
|
Heart Failure |
7/2019 - 6/2022 |
|
|
Hospital-wide |
7/2019 - 6/2022 |
|
|
Pneumonia |
7/2019 - 6/2022 |
|
|
Total hip arthroplasty and/or total knee arthroplasty |
7/2019 - 6/2022 |
|
|
Payment |
Acute Myocardial Infarction |
7/2019 - 6/2022 |
|
Heart Failure |
7/2019 - 6/2022 |
|
|
Pneumonia |
7/2019 - 6/2022 |
|
|
Total hip arthroplasty and/or total knee arthroplasty |
4/2019 - 3/2022 |
|
|
Excess Days in Acute Care |
Acute Myocardial Infarction |
7/2019 - 6/2022 |
|
Heart Failure |
7/2019 - 6/2022 |
|
|
Pneumonia |
7/2019 - 6/2022 |
Only hospitals with at least 25 qualifying hospitalizations for a given measure are included in the visualization.
Beginning with the 2019 reporting year, the stroke readmission measure was removed from this data visualization because this measure is no longer reported in the Inpatient Quality Reporting Program (IQR). This measure’s results are still available in reporting years prior to 2019.
DEFINITIONS
Table 2. Key Definitions
|
Term |
Definition |
|
Within Outcomes |
Comparison of different conditions within a specified outcome (ex. AMI mortality vs. Heart failure mortality) |
|
Across Outcomes |
Comparison of the same condition (with the same cohort of patients) across different outcomes (ex. AMI mortality vs. AMI payment) |
|
Quartiles |
Four equal groups into which a population can be divided per the distribution of values |
|
Quintiles |
Five equal groups into which a population can be divided per the distribution of values |
|
Reference Measure |
Measure of interest or measure used to compare to all remaining measures with the same outcome |
|
Scatterplot |
A scatterplot is used to display values for two variables in a set of data. Scatterplots are used to examine how much one variable is affected by another. |
|
Performance categories |
To categorize hospital performance, hospitals are classified based on their risk-standardized rate and the associated 95% interval estimate as: |
|
Payment "performance" categories |
To categorize hospital payment results, hospitals are classified based on their risk-standardized payment and the associated 95% interval estimate as: |
Methodology Sources
AMI, COPD, Heart Failure, and Pneumonia Readmission Measures Methodology: DeBuhr J, McDowell K, Grady J, et al. 2023 Condition-Specific Measures Updates and Specifications Report Hospital-Level 30-Day Risk-Standardized Readmission Measures: Acute Myocardial Infarction – Version 16.0, Chronic Obstructive Pulmonary Disease – Version 12.0, Heart Failure – Version 16.0, Pneumonia – Version 16.0. https://qualitynet.cms.gov/inpatient/measures/readmission/resources Available as of Spring 2023.
CABG and Hip/Knee Arthroplasty Readmission Measures Methodology: DeBuhr J, McDowell K, Grady J, et al. 2023 Procedure-Specific Measures Updates and Specifications Report Hospital-Level 30-Day Risk-Standardized Readmission Measures: Isolated Coronary Artery Bypass Graft (CABG) Surgery – Version 10.0, Elective Primary Total Hip Arthroplasty (THA) and/or Total Knee Arthroplasty (TKA) – Version 12.0. https://qualitynet.cms.gov/inpatient/measures/readmission/methodology Available as of Spring 2023.
AMI, COPD, Heart Failure, Pneumonia, and Stroke Mortality Measures Methodology: DeBuhr J, McDowell K, Grady J, et al. 2023 Condition-Specific Measures Updates and Specifications Report Hospital-Level 30-Day Risk-Standardized Mortality Measures: Acute Myocardial Infarction – Version 17.0, Chronic Obstructive Pulmonary Disease – Version 12.0, Heart Failure – Version 17.0, Pneumonia – Version 17.0, Stroke – Version 12.0. https://qualitynet.cms.gov/inpatient/measures/mortality/resources. Available as of Spring 2023.
CABG Mortality Measure Methodology: DeBuhr J, McDowell K, Grady J, et al. 2023 Procedure-Specific Measure Updates and Specifications Report Hospital-Level 30-Day Risk-Standardized Mortality Measure: Isolated Coronary Artery Bypass Graft (CABG) Surgery – Version 10.0. https://qualitynet.cms.gov/inpatient/measures/mortality/methodology. Available as of Spring 2023.
Hip/Knee Arthroplasty Complication Measure Methodology: DeBuhr J, McDowell K, Grady J, et al. 2023 Procedure-Specific Measure Updates and Specifications Report Hospital-Level Risk-Standardized Complication Measure: Elective Primary Total Hip Arthroplasty (THA) and/or Total Knee Arthroplasty (TKA) – Version 12.0. https://qualitynet.cms.gov/inpatient/measures/complication/resources Available as of Spring 2023.
AMI, Heart Failure, Pneumonia, and Elective Primary Total Hip Arthroplasty (THA) and/or Total Knee Arthroplasty (TKA) Payment Measures Methodology: DeBuhr J, McDowell K, Grady J, et al. 2023 Measure Updates and Specifications Report Hospital-Level Risk-Standardized Payment Measures: Acute Myocardial Infarction – Version 12.0, Heart Failure – Version 10.0, Pneumonia – Version 10.0, Elective Primary Total Hip Arthroplasty (THA) and/or Total Knee Arthroplasty (TKA) – Version 9.0. https://qualitynet.cms.gov/inpatient/measures/payment/resources Available as of Spring 2023.
AMI, Heart Failure, Pneumonia Excess Days in Acute Care Measure Methodology: DeBuhr J, McDowell K, Grady J, et al. 2023 Condition-Specific Measures Updates and Specification Report Hospital-Level 30-Day Risk-Standardized Excess Days in Acute Care Measures: Acute Myocardial Infarction – Version 8.0, Heart Failure – Version 8.0, Pneumonia – Version 7.0. https://qualitynet.cms.gov/inpatient/measures/edac/resources Available as of Spring 2023.
Hospital-Wide Readmission Measure Methodology: DeBuhr J, McDowell K, Grady J, et al. 2020 All-Cause Hospital-Wide Measure Updates and Specifications Report: Hospital-Level 30-Day Risk-Standardized Readmission Measure – Version 12.0 https://qualitynet.cms.gov/inpatient/measures/readmission/methodology Available as of Spring 2023.
Related Research
To view PDF documents you will need the Adobe Acrobat Reader.
-
AMI, COPD, Heart Failure, Pneumonia, and Stroke Mortality: Hospital Variation
[PDF, 252.01 KB]Variation in 30-day mortality rates across hospitals following admission for AMI, COPD, Heart Failure, Pneumonia and Stroke (July 2013 -…
-
AMI Payment: Results by Hospital Characteristic
[PDF, 185.34 KB]AMI payment measure results by hospital characteristics: safety-net status, teaching status, and urban or rural location (July 2011 - June…
-
COPD Readmission: Results by Hospital Characteristic
[PDF, 187.2 KB]COPD readmission measure results by hospital characteristics: safety-net status, teaching status, and urban or rural location (July 2011 -…