How This Is Calculated
The following hypothetical example demonstrates how the visualization is calculated, using Medicare and Medicaid dual eligibility as the social risk factor:
1. Overall state performance is calculated for the combined dually eligible ("dual") and non-dual population. Per 1000 admissions in the state:
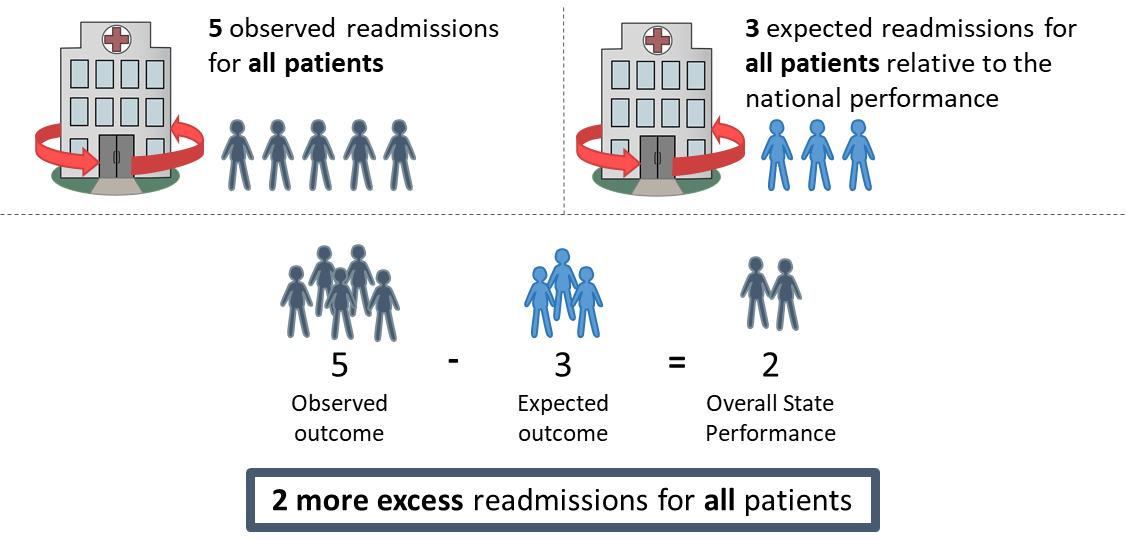
2. Population of dual and non-dual patients is calculated as the percent of each population out of the entire state population.

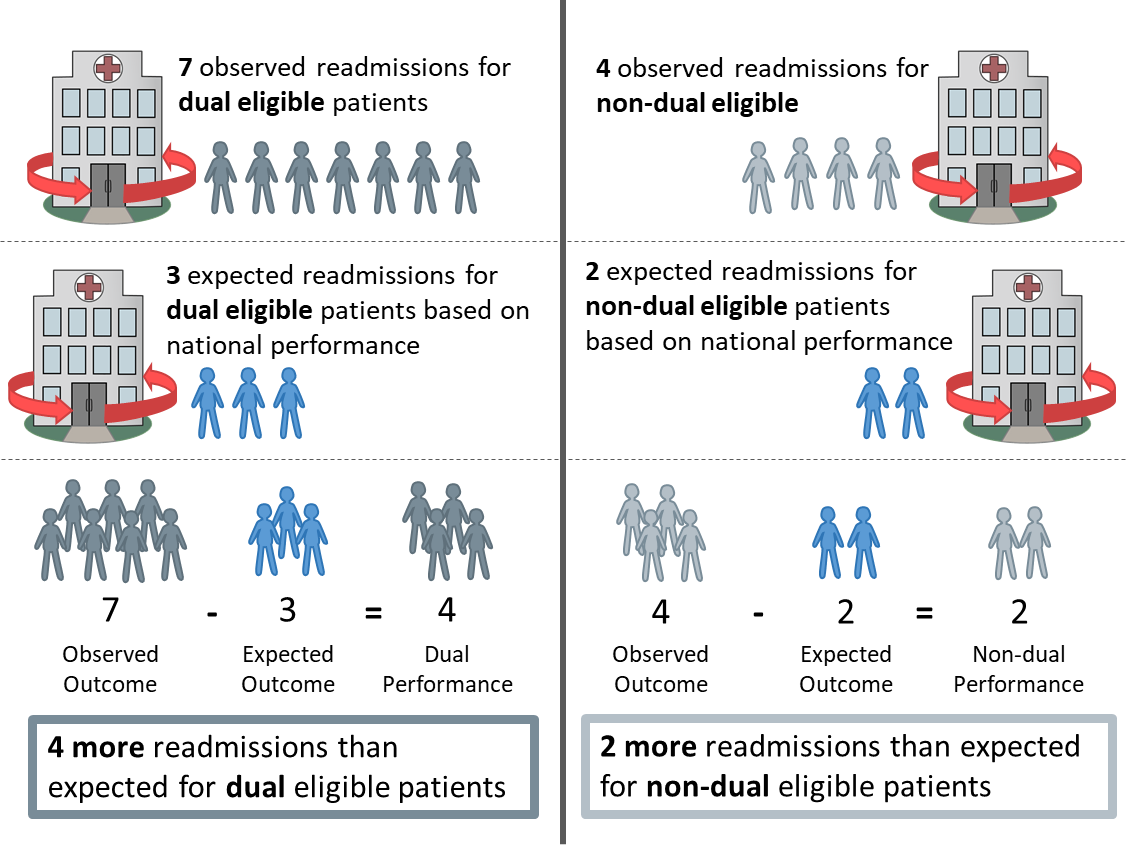
3. Performance is calculated for the dual and non-dual populations for each state by calculating the difference between the observed outcome and the expected outcome based on the national performance for each state. Per 1000 admissions in the state:
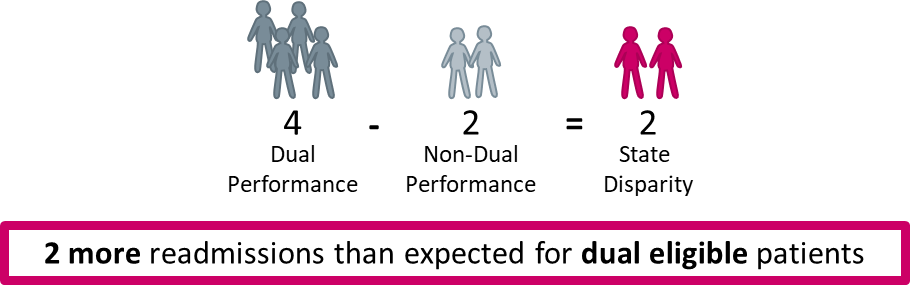
4. The disparity between the dual and non-dual population is calculated as the absolute difference between the dual and non-dual performance.
Notes
Table 1. Social Risk Factors Definitions
|
Social Risk Factor |
Definition |
|---|---|
| Dual Eligibility Status | Patients are in this category if they are a part of Medicare Part A or Medicare Part B as well as Medicaid. |
| Poverty Line | Patients who fit into this category have a family income that is lower than 90 percent of people in the US. |
| Low Education | Patients fit into this category if they have a level of education lower than 90 percent of people in the US. |
| Unemployed | Patients from zip codes where more than 11.5% of the residents aged 16 years or older are in the labor force who are unemployed and actively seeking work. |
| AHRQ SES Index Score | Patients from zip codes with an Agency for Healthcare Research & Quality (AHRQ) socioeconomic status (SES) index score below 31.8. |
Methodology Sources
AMI, COPD, Heart Failure, Pneumonia, and Stroke Readmission Measures Methodology: Jaymie Simoes, Jacqueline N. Grady, Jo DeBuhr, et al. 2018 Condition-Specific Measures Updates and Specifications Report Hospital-Level 30-Day Risk-Standardized Readmission Measures: Acute Myocardial Infarction – Version 10.0, Chronic Obstructive Pulmonary Disease – Version 6.0, Heart Failure – Version 10.0, Pneumonia – Version 10.0, Stroke – Version 6.0. https://www.qualitynet.org/inpatient/measures/readmission/resources#tab3. Available as of April 4, 2018.
CABG and Hip/Knee Arthroplasty Readmission Measures Methodology: Jaymie Simoes, Jacqueline N. Grady, Jo DeBuhr, et al. 2018 Procedure-Specific Measures Updates and Specifications Report Hospital-Level 30-Day Risk-Standardized Readmission Measures: Isolated Coronary Artery Bypass Graft (CABG) Surgery – Version 4.0, Elective Primary Total Hip Arthroplasty (THA) and/or Total Knee Arthroplasty (TKA) – Version 6.0. https://www.qualitynet.org/inpatient/measures/readmission/resources#tab3. Available as of April 4, 2018.
AMI, COPD, Heart Failure, Pneumonia, and Stroke Mortality Measures Methodology: Jaymie Simoes, Jacqueline N. Grady, Jo DeBuhr, et al. 2018 Condition-Specific Measures Updates and Specifications Report Hospital-Level 30-Day Risk-Standardized Mortality Measures: Acute Myocardial Infarction – Version 11.0, Chronic Obstructive Pulmonary Disease – Version 6.0, Heart Failure – Version 11.0, Pneumonia – Version 11.0, Stroke – Version 6.0. https://www.qualitynet.org/inpatient/measures/mortality/resources#tab3. Available as of April 4, 2018.
CABG Mortality Measure Methodology: Jaymie Simoes, Jacqueline N. Grady, Jo DeBuhr, et al. 2018 Procedure-Specific Measure Updates and Specifications Report Hospital-Level 30-Day Risk-Standardized Mortality Measure: Isolated Coronary Artery Bypass Graft (CABG) Surgery – Version 4.0. https://www.qualitynet.org/inpatient/measures/mortality/resources#tab3 Available as of April 4, 2018.
Hip/Knee Arthroplasty Complication Measure Methodology: Jaymie Simoes, Jacqueline N. Grady, Jo DeBuhr, et al. 2018 Procedure-Specific Measure Updates and Specifications Report Hospital-Level Risk-Standardized Complication Measure: Elective Primary Total Hip Arthroplasty (THA) and/or Total Knee Arthroplasty (TKA) – Version 6.0. https://www.qualitynet.org/inpatient/measures/complication/resources#tab3. Available as of April 4, 2018.